
|
|
|
| Latitude: | N 51º 52' 03" |
| Longitude: | E 00º 10' 16" |
| Elevation: | 280 ft |
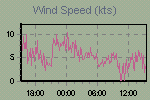
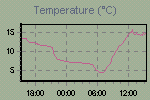
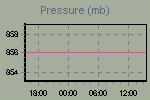
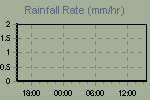
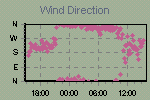
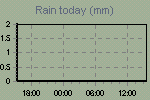
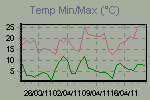
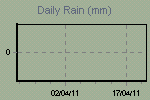
These graphs present the temperature, pressure, rainfall, and wind speed trends for the last 24 hours.
The thumbnail graphs are sampled every ten minutes. Click on a thumbnail to display the corresponding larger graph in the panel above it. The large graphs are sampled every minute.
Weather data is collected using the Oregon Scientific WMR-928 Weather Station and these pages are updated every 10 minutes.

Click on a thumbnail to show a large graph in the panel above. |
 |
 |
 |
 |
 |
 |
 |
 |
| | now | today | records | trends | | |||
Page last updated 22/04/11 10:10:00
©nybbles 2003
Cumulus weather station software v1.3.1 by
Steve Loft
page design v1.1 by Steve and
Beth Loft